 Back Home
| MLS Statistics for MIAAOR (Marco Island Only) – Feb 2014 | ||||||||||||
| MARCO MULTI/LIST – Compiled on March 6, 2014 | ||||||||||||
| Feb 2014 | Jan 2014 | Change | Feb 2013 | Change | ||||||||
| New Listings | ||||||||||||
| Single Family / RE1 | 73 | 90 | -18.89% | 82 | -10.98% | |||||||
| Lots | 26 | 46 | -43.48% | 29 | -10.34% | |||||||
| Multi-family / RE2 | 79 | 100 | -21.00% | 86 | -8.14% | |||||||
| Total All Property Types | 184 | 240 | -23.33% | 205 | -10.24% | |||||||
| Feb 2014 | Jan 2014 | Change | Feb 2013 | Change | ||||||||
| Active Listings | ||||||||||||
| Single Family / RE1 | 400 | 396 | 1.01% | 381 | 4.99% | |||||||
| Lots | 279 | 278 | 0.36% | 282 | -1.06% | |||||||
| Multi-family / RE2 | 398 | 402 | -1.00% | 559 | -28.80% | |||||||
| Total All Property Types | 1,138 | 1,135 | 0.26% | 1,284 | -11.37% | |||||||
| Feb 2014 | Jan 2014 | Change | Feb 2013 | Change | ||||||||
| Pending Listings | ||||||||||||
| Single Family / RE1 | 63 | 87 | -27.59% | 42 | 50.00% | |||||||
| Lots | 26 | 32 | -18.75% | 23 | 13.04% | |||||||
| Multi-family / RE2 | 84 | 93 | -9.68% | 56 | 50.00% | |||||||
| Total All Property Types | 176 | 214 | -17.76% | 124 | 41.94% | |||||||
| Feb 2014 | Jan 2014 | Change | Feb 2013 | Change | ||||||||
| Single Family/RE1 Sold | ||||||||||||
| Closed | 26 | 29 | -10.34% | 39 | -33.33% | |||||||
| Average Sale Price ($) | $877,369 | $750,921 | 16.84% | $667,717 | 31.40% | |||||||
| Median Sale Price ($) | $719,250 | $500,000 | 43.85% | $499,000 | 44.14% | |||||||
| Total Sold Dollar Volume | $22,811,600 | $21,776,700 | 4.75% | $26,040,950 | -12.40% | |||||||
| Closed in 30 Days | 0.00% | 0.00% | 0.00% | 5.13% | -100.00% | |||||||
| 60 Days | 15.38% | 10.34% | 48.72% | 15.38% | 0.00% | |||||||
| 90 Days | 3.85% | 6.90% | -44.23% | 12.82% | -70.00% | |||||||
| 120 Days | 11.54% | 3.45% | 234.62% | 17.95% | -35.71% | |||||||
| 121+ Days | 69.23% | 79.31% | -12.71% | 48.72% | 42.11% | |||||||
| Feb 2014 | Jan 2014 | Change | Feb 2013 | Change | ||||||||
| Lots Sold | ||||||||||||
| Closed | 11 | 20 | -45.00% | 22 | -50.00% | |||||||
| Average Sale Price ($) | $439,091 | $273,415 | 60.60% | $236,883 | 85.36% | |||||||
| Median Sale Price ($) | $251,000 | $231,000 | 8.66% | $193,700 | 29.58% | |||||||
| Total Sold Dollar Volume | $4,830,000 | $5,468,300 | -11.67% | $5,211,427 | -7.32% | |||||||
| Closed in 30 Days | 9.09% | 5.00% | 81.82% | 9.09% | 0.00% | |||||||
| 60 Days | 9.09% | 10.00% | -9.09% | 9.09% | 0.00% | |||||||
| 90 Days | 18.18% | 0.00% | 0.00% | 13.64% | 33.33% | |||||||
| 120 Days | 9.09% | 10.00% | -9.09% | 4.55% | 100.00% | |||||||
| 121+ Days | 54.55% | 75.00% | -27.27% | 63.64% | -14.29% | |||||||
| Feb 2014 | Jan 2014 | Change | Feb 2013 | Change | ||||||||
| Multi-family/RE2 Sold | ||||||||||||
| Closed | 46 | 38 | 21.05% | 32 | 43.75% | |||||||
| Average Sale Price ($) | $531,047 | $529,316 | 0.33% | $509,431 | 4.24% | |||||||
| Median Sale Price ($) | $351,000 | $378,000 | -7.14% | $370,000 | -5.14% | |||||||
| Total Sold Dollar Volume | $24,428,165 | $20,114,000 | 21.45% | $16,301,800 | 49.85% | |||||||
| Closed in 30 Days | 0.00% | 0.00% | 0.00% | 0.00% | 0.00% | |||||||
| 60 Days | 19.57% | 18.42% | 6.21% | 3.13% | 526.09% | |||||||
| 90 Days | 13.04% | 10.53% | 23.91% | 9.38% | 39.13% | |||||||
| 120 Days | 8.70% | 15.79% | -44.93% | 9.38% | -7.25% | |||||||
| 121+ Days | 58.70% | 55.26% | 6.21% | 78.13% | -24.87% | |||||||
| Feb 2014 | Jan 2014 | Change | Feb 2013 | Change | ||||||||
| Total All Property Types Sold | ||||||||||||
| Closed | 87 | 88 | -1.14% | 95 | -8.42% | |||||||
| Average Sale Price ($) | $614,365 | $546,693 | 12.38% | $513,939 | 19.54% | |||||||
| Median Sale Price ($) | $489,900 | $378,000 | 29.60% | $375,000 | 30.64% | |||||||
| Total Sold Dollar Volume | $53,449,765 | $48,109,000 | 11.10% | $48,824,177 | 9.47% | |||||||
| Closed in 30 Days | 2.30% | 1.14% | 102.30% | 4.21% | -45.40% | |||||||
| 60 Days | 16.09% | 13.64% | 18.01% | 9.47% | 69.86% | |||||||
| 90 Days | 10.34% | 6.82% | 51.72% | 11.58% | -10.66% | |||||||
| 120 Days | 9.20% | 10.23% | -10.09% | 11.58% | -20.59% | |||||||
| *All Property Types include Single Family/RE1, Lot, Commercial, Multi-family/RE2, RIN, Dock, Business, Land, and Timeshare properties. | ||||||||||||
| ALL INFORMATION DEEMED RELIABLE BUT NOT GUARANTEED, AND THE MARCO ISLAND ASSOCIATION OF REALTORS IS THE SOURCE OF THIS INFORMATION.
|
||||||||||||
Category Archives: Market News
MARCO ISLAND IS VOTED NO. 1
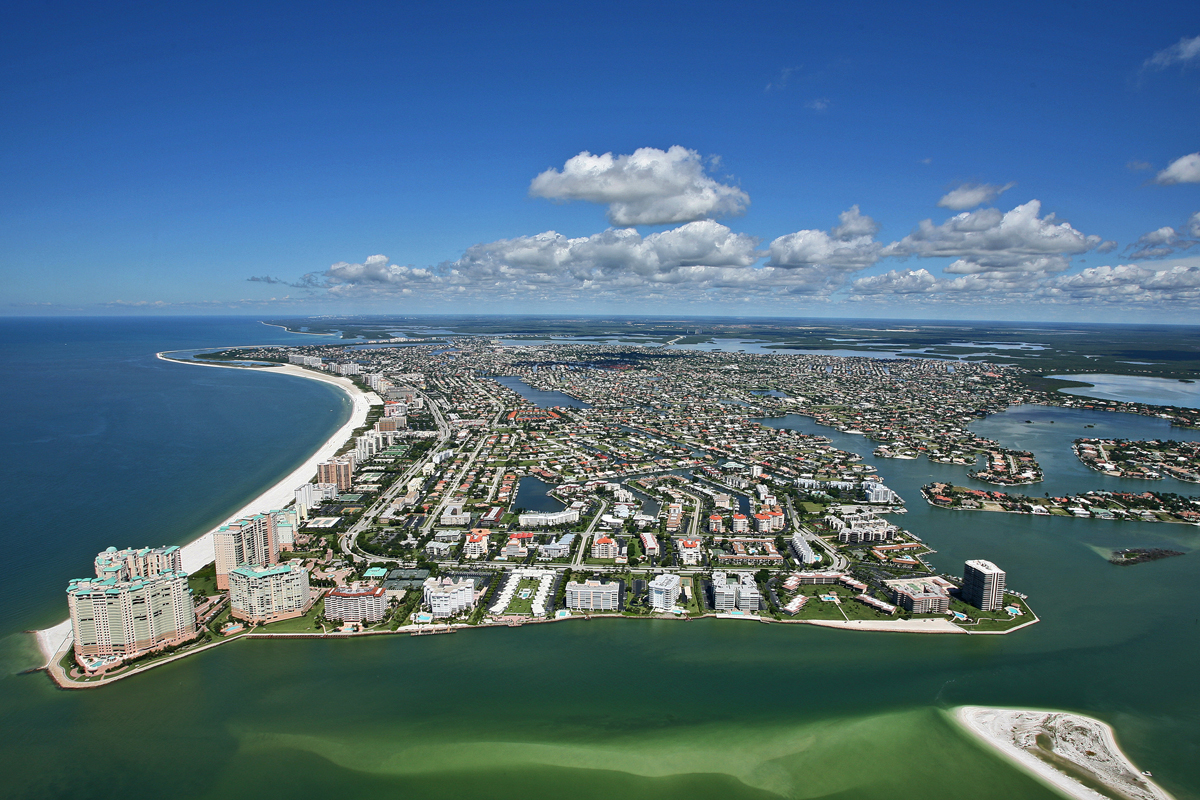
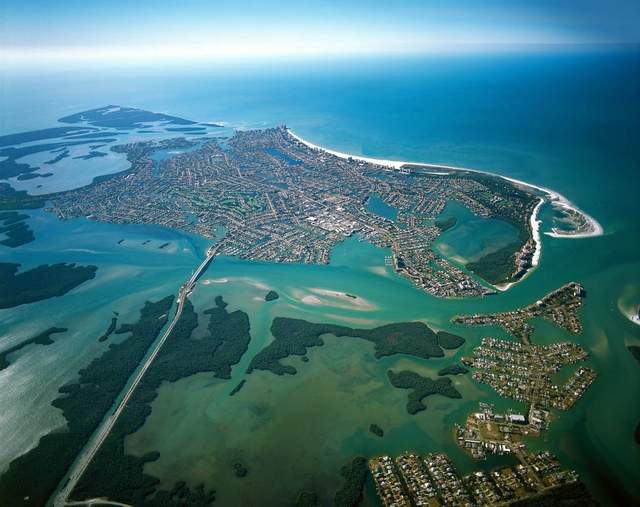
Marco Island is “trending” all over the Internet right now on the strength of being chosen TripAdvisor’s 2014 best island in the United States. Beefing up that image, and particularly delighting local resort managers and business owners, is a fourth place in the world. That means the site’s voters rate Marco and its attractions above some very fine worldwide destinations. Facebook and Twitter are alive with comments on Marco, and international papers and news sources are still publishing and commenting on the results. Criteria for the awards are not specifically listed by the site, but they are based on contributing travelers’ reviews and ratings of hotels, restaurants and attractions over 12 months. The free site is supported by an advertising business model with shares at the moment topping $100. In its description of Marco, TripAdvisor describes the island as a perfect destination for those who crave a peaceful retreat, but don’t have time to travel too far off the grid. “The jewel of Florida’s Ten Thousand Islands, Marco Island’s soft white beaches overlook the sparkling waters of the Gulf of Mexico,” states the site. “Scavenge for seashells or hit the links for a sunny session of golf. Explore the Everglades in a swamp buggy, or enjoy a rejuvenating nature hike at the Rookery Bay Reserve.” Also on the United States podium, so to speak, are Chincoteague Island, Va., and Anna Maria Island near Bradenton. Top world destinations just edging Marco are Ambertris Caye, Belize Caye; Prividenciales, Turks & Caicos, and Bora Bora, Society Islands. But Marco beats out islands such as Lewis and Harris, Outer Hebrides; Naxos in the Aegean Sea; Aitutaki in the Southern Cook Islands, and Nosy Be in Madagascar.
A snap survey of local residents, innkeepers and business people revealed that Marco Islanders weren’t really taken by surprise at the results. Chamber President Jacquie Koon: “Trip advisor’s rating confirms what many have known for years. Marco island provides a unique ambiance that is well-suited for all.
PLEASE COME AND ENJOY OUR BEAUTIFUL MARCO ISLAND AND DISCOVER FOR YOURSELF ALL IT HAS TO OFFER !
Over a half billion dollars of real estate closed during the first nine months of 2013 on Marco Island
MLS statistics, released by the Marco Island Area Association of Realtors ® for Marco Island only properties compared the first three quarters of 2013 to 2012.
Recap of what happened in the Marco Island Real Estate market.
- Sold Single Family Home Sales up 10% (325 vs. 295)
- Sold Condominium Sales up 13% (448 vs. 398)
- Sold Single Family Vacant Lots down 5% (142 vs. 150)
- Average Sale Price Single Family Home up 11% ($763k vs. $689k)
- Average Sale Price Condominium up 11% ($468k vs. $423k)
- Average Sale Price Single Family Vacant Lot up 32% ($387k vs. 293k)
- Total Dollar Value of all Single Family Homes Sold up 22% ($248M vs. $203M)
- Total Dollar Value of all Condominiums Sold up 25% ($210M vs. $168M)
- Total Dollar Value of all Single Family Vacant Lots Sold up 25% (55M vs. 44M)
Current Inventory:
- 304 Single Family Homes (down .3% from 2012)
- 364 Condominiums (down 29% from 2012)
- 241 Single Family Lots (down 7% from 2012)
Summary:
Over a half BILLION dollars of real estate has closed on Marco Island during the first nine months of 2013. Whew… Without question the appetite for Marco Island real estate was as strong as it’s ever been during the past three quarters, average prices were up, dollar value was up, median prices were up. However, the decrease in inventory has resulted in a bit of a let up over the last couple of months and our break-neck pace is easing. Bank appraisals are keeping prices fairly in check and interest rates are still excellent with the 30 year fixed rate at about 4.5%.
Other indicators of note are the average days a property is on the market is down about 10% from 299 to 269 and the list price to sales price ratio is up 2% from 90% to 92% (this means the average amount “negotiated” is 8%.) The market seems healthy and buyers seem ready to get their piece of Paradise.